How to Train an LLM: Part 2

This is a continuation from Part 1 of the saga.
My plan for this blog was to run performance optimization, architecture search, etc... until (spoiler) I faced a gnarly bug while trying to figure out the best LR.
As I mentioned in Part 1, this is more of a log of my experiments than a polished explainer but you’ll probably pick up a thing or two.
Performance Optimizations
This will be an optimization heavy blog. I want to make my run cheaper and converge faster. To be honest, a few percent savings at this scale don’t really matter... I just do this for the love of the FLOPs. I wanted to tweak architecture and test out more data/hyperparam ideas but that should come after I make infra optimizations. These optimizations will aim to reduce memory usage and increase training throughput.
Let's start with the elephant in the room: getting Flash Attention 3 to work.
Flash Attention 3
In the last blog, we omitted FA3 and went for standard torch SDPA. I tried really hard to get it to work, I spent hours on the debugger, begged the threads to cooperate, flipped some settings, etc., and I think I finally know what the problem is.
It's definitely not an autocast thing... I'm pretty sure it's a torch.compile thing.
Without torch.compile, these are the first three train steps with and without FA3 on an [8, 2048] input.
Using Flash Attention 3
Step #0 | Time: 0.596s | Allocated: 14.97 GB | Peak: 29.36 GB | Reserved: 36.52 GB
Step #1 | Time: 0.407s | Allocated: 14.97 GB | Peak: 39.33 GB | Reserved: 53.70 GB
Step #2 | Time: 0.406s | Allocated: 14.97 GB | Peak: 39.33 GB | Reserved: 53.70 GB

Using PyTorch SDPA
Step #0 | Time: 0.604s | Allocated: 14.97 GB | Peak: 29.36 GB | Reserved: 36.52 GB
Step #1 | Time: 0.428s | Allocated: 14.97 GB | Peak: 39.33 GB | Reserved: 53.70 GB
Step #2 | Time: 0.427s | Allocated: 14.97 GB | Peak: 39.33 GB | Reserved: 53.70 GB
I ignore Step #0 and #1 in both runs, since it’s dominated by compilation/warmup. Notice the same memory usage, with FA3 about ~3–4% faster. Now, this is with torch.compile (fullgraph=False as FA3 is not compilable yet).
Flash Attention 3
Step #0 | Time: 2.035s | Allocated: 7.48 GB | Peak: 25.20 GB | Reserved: 29.57 GB
Step #1 | Time: 0.390s | Allocated: 7.48 GB | Peak: 30.17 GB | Reserved: 16.79 GB
Step #2 | Time: 0.360s | Allocated: 7.52 GB | Peak: 30.07 GB | Reserved: 38.26 GB
Step #3 | Time: 0.364s | Allocated: 7.52 GB | Peak: 30.07 GB | Reserved: 38.26 GB
Step #4 | Time: 0.358s | Allocated: 7.52 GB | Peak: 30.07 GB | Reserved: 38.26 GB

PyTorch SDPA
Step #0 | Time: 30.30s | Allocated: 7.45 GB | Peak: 11.59 GB | Reserved: 18.23 GB
Step #1 | Time: 0.339s | Allocated: 7.45 GB | Peak: 16.56 GB | Reserved: 18.23 GB
Step #2 | Time: 0.294s | Allocated: 7.45 GB | Peak: 7.45 GB | Reserved: 18.23 GB
Step #3 | Time: 0.301s | Allocated: 7.45 GB | Peak: 7.45 GB | Reserved: 18.23 GB
Step #4 | Time: 0.309s | Allocated: 7.45 GB | Peak: 7.45 GB | Reserved: 18.23 GB
SDPA is compile-compatible (mouthful ik) so torch can reserve memory more optimally. With FA3, since it's a black box op and not torch-compile-compatible, it reserves more memory. Sadly, the conclusion is to stick with SDPA since it's faster when compiled and consumes less memory. We might have to revisit FA3 if our FP8 experiments end up working (low-precision attention + hopper-specifics is the main selling point from what I heard).
Note: If you are an expert and think my conclusion is incorrect, I'd love to hear from you!
Gradient Checkpointing
In the last blog, I checkpointed the whole decoder block. Gradient checkpointing trades memory for compute: instead of storing all intermediate activations for backprop, you re-compute them on the backward pass for the layers you “checkpoint”.
Here I want to understand the compute-memory tradeoff of different parts of the decoder block on a [16, 2048] input. I’ll selectively checkpoint different ops from the following DecoderBlock module and measure performance.
class CheckpointedDecoderBlock(nn.Module):
    def __init__(self, config: ModelConfig):
        super().__init__()
        self.attn_norm = RMSNorm(config)
        self.attention = Attention(config)
        self.swiglu_norm = RMSNorm(config)
        self.swiglu = SwiGLU(config)

    def forward(self, x: torch.Tensor, cos_cached: torch.Tensor, sin_cached: torch.Tensor):
        norm = self.attn_norm(x)
        attn = self.attention(norm, cos_cached, sin_cached)
        x = x + attn
        norm = self.swiglu_norm(x)
        swiglu = self.swiglu(norm)
        x = x + swiglu
        return x
| Configuration | Δ Compute vs Baseline | Δ Reserved Memory vs Baseline |
|---|---|---|
| Baseline | 0% | 0% |
| Embedding | ~0% | −0.5% |
| Attn + SwiGLU Norms | ~0% | ~0% |
| Attention | +6% | −11% |
| SwiGLU | +6% | −40% |
| Full Block | +17% | −56% |
To be fair, full gradient checkpointing does not hit MFU as bad as I thought. Checkpointing just the SwiGLU MLP looks like the best trade-off here. If I can claw back memory elsewhere without touching checkpointing, I can even dial back checkpointing later and squeeze out a bit more MFU.
Eliminate logits
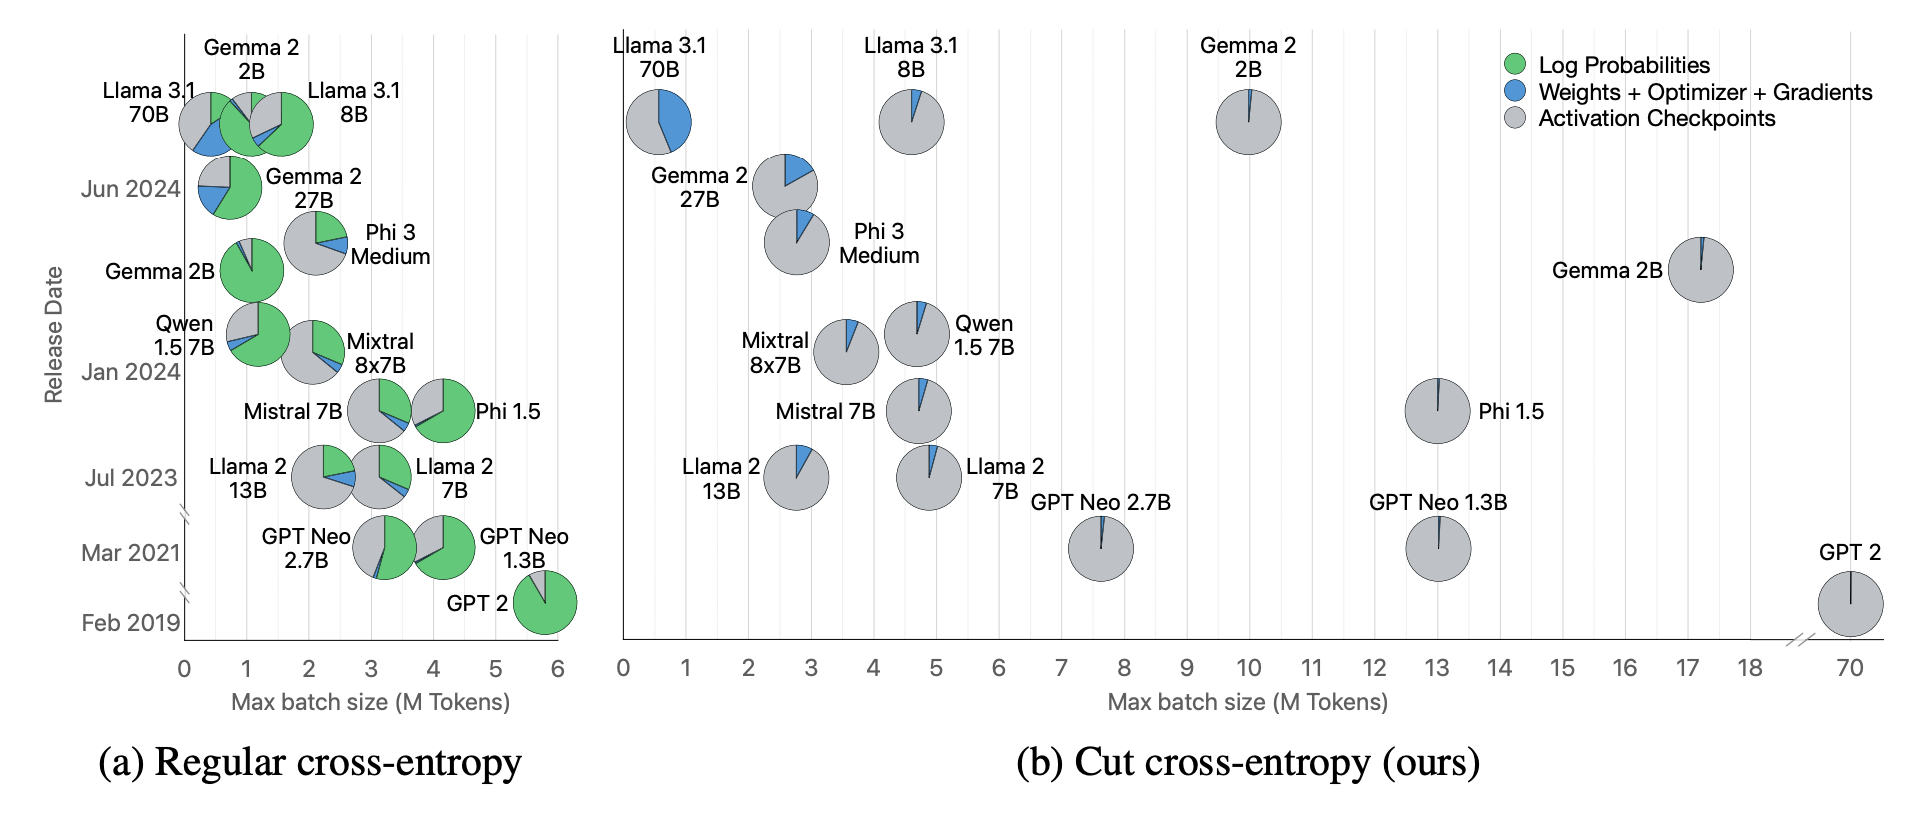
Fused/Chunked cross-entropy variants are popular now. They reduce memory during the loss computation by avoiding a full [batch, seq, vocab] logits tensor. I already have a blog on one such variant - Cut Cross Entropy by Apple - and my failed experiment with it.
Chunked Cross Entropy computes the softmax/loss in chunks over the vocab dimension (like flash attn), so you never materialize the full [batch, seq, vocab] logits tensor. Memory savings shown in this visual from Apple's CCE paper.
Liger Kernels
LinkedIn's Liger Kernels gained popularity for their Fused Linear Cross Entropy implementation which touts big perf gains.
There aren't a large number of reference implementations out in the wild for this, so I took whatever is in their Readme, read their paper and repo code, and adapted it to my code.
I replaced
logits = self.lm_head(x)
loss = torch.nn.functional.cross_entropy(
    logits.reshape(-1, logits.shape[-1]),
    targets.reshape(-1)
)
with:
In LLM.__init__():
self.lce = LigerFusedLinearCrossEntropyLoss()

In LLM.forward():
x_flat = x.reshape(-1, x.shape[-1])
targets_flat = targets.reshape(-1)

loss = self.lce(
    self.lm_head.weight,
    x_flat,
    targets_flat
)
I noticed something weird, these results are with torch.compile (fullgraph=False because liger kernel has graph breaks on .item()) on [32, 2048] inputs.
Linear Cross Entropy
Step #0 | Time: 53.53s | Allocated: 14.90 GB | Peak: 45.54 GB | Reserved: 66.24 GB
Step #1 | Time: 0.700s | Allocated: 14.90 GB | Peak: 55.47 GB | Reserved: 66.24 GB
Step #2 | Time: 0.654s | Allocated: 14.90 GB | Peak: 14.90 GB | Reserved: 66.24 GB

Regular Cross Entropy
Step #0 | Time: 34.526s | Allocated: 14.90 GB | Peak: 19.87 GB | Reserved: 29.59 GB
Step #1 | Time: 0.652s | Allocated: 14.90 GB | Peak: 29.03 GB | Reserved: 29.59 GB
Step #2 | Time: 0.610s | Allocated: 14.90 GB | Peak: 14.90 GB | Reserved: 29.59 GB
torch.compile asked me to add torch._dynamo.config.capture_scalar_outputs = True and I got
Linear Cross Entropy
Step #0 | Time: 1.426s | Allocated: 14.97 GB | Peak: 19.93 GB | Reserved: 19.96 GB
Step #1 | Time: 0.936s | Allocated: 14.97 GB | Peak: 25.37 GB | Reserved: 26.54 GB
Step #2 | Time: 0.937s | Allocated: 14.97 GB | Peak: 25.37 GB | Reserved: 26.54 GB
What on gawd's green earth did I just witness... LCE is slower and hogs more memory? So, I turned torch.compile off and ran the bench again on [16, 2048] token inputs.
Linear Cross Entropy
Step #0 | Input Size: [16, 2048] | Time: 1.440s | Reserved: 19.96 GB
Step #1 | Input Size: [16, 2048] | Time: 0.939s | Reserved: 26.54 GB
Step #2 | Input Size: [16, 2048] | Time: 0.943s | Reserved: 26.54 GB

Regular Cross Entropy
Step #0 | Input Size: [16, 2048] | Time: 0.992s | Reserved: 65.35 GB
Step #1 | Input Size: [16, 2048] | Time: 0.825s | Reserved: 82.53 GB
Step #2 | Input Size: [16, 2048] | Time: 0.828s | Reserved: 82.53 GB
Without torch.compile, LCE behaves more like the marketing claims: it trades ~10–15% more step time for a massive drop in reserved memory (from ~82 GB to ~27 GB in my config). Based on the math (16×2048×131072×2 bytes), I'd expect ~8GB less activation memory from logits. I honestly don't know what to make of these results. For now, let's skip this and try Apple's cut cross entropy.
Cut Cross Entropy
I’m very tempted to roll my own LCE kernel, but I want to exhaust all the easy wins first. Cut Cross entropy is by Apple, these are results with torch.compile with [64, 2048]:
Cut Cross Entropy (Vanilla)
Step #0 | Batch Size: (64, 2048) | Time: 34.40s | Reserved Memory: 57.62 GB | Loss: 11.10
Step #1 | Batch Size: (64, 2048) | Time: 2.844s | Reserved Memory: 58.69 GB | Loss: 9.118
Step #2 | Batch Size: (64, 2048) | Time: 2.811s | Reserved Memory: 59.76 GB | Loss: 7.811

Cut Cross Entropy (FP32 Accum)
Step #0 | Batch Size: (64, 2048) | Time: 36.084s | Reserved Memory: 57.63 GB | Loss: 11.103
Step #1 | Batch Size: (64, 2048) | Time: 3.042s | Reserved Memory: 58.70 GB | Loss: 9.091
Step #2 | Batch Size: (64, 2048) | Time: 3.002s | Reserved Memory: 58.70 GB | Loss: 7.609

Cut Cross Entropy (Kahan Sum)
Step #0 | Batch Size: (64, 2048) | Time: 38.861s | Reserved Memory: 57.63 GB | Loss: 11.103
Step #1 | Batch Size: (64, 2048) | Time: 3.694s | Reserved Memory: 58.70 GB | Loss: 9.097
Step #2 | Batch Size: (64, 2048) | Time: 3.618s | Reserved Memory: 58.70 GB | Loss: 7.618

Regular Cross Entropy
Step #0 | Batch Size: (64, 2048) | Time: 55.47s | Reserved Memory: 73.76 GB | Loss: 11.10
Step #1 | Batch Size: (64, 2048) | Time: 2.431s | Reserved Memory: 73.77 GB | Loss: 9.097
Step #2 | Batch Size: (64, 2048) | Time: 2.371s | Reserved Memory: 73.77 GB | Loss: 7.616
Apple's implementation has a few good options to improve numerical stability (which I want to prioritize for similar convergence). For FP32 CCE vs Regular, memory drops by 23% (16GB) while step time increases by 41%. The experiment on my last blog used the default CCE implementation and it did not converge as well (I expect due to numerical instability).
These are results with CCE vs baseline:
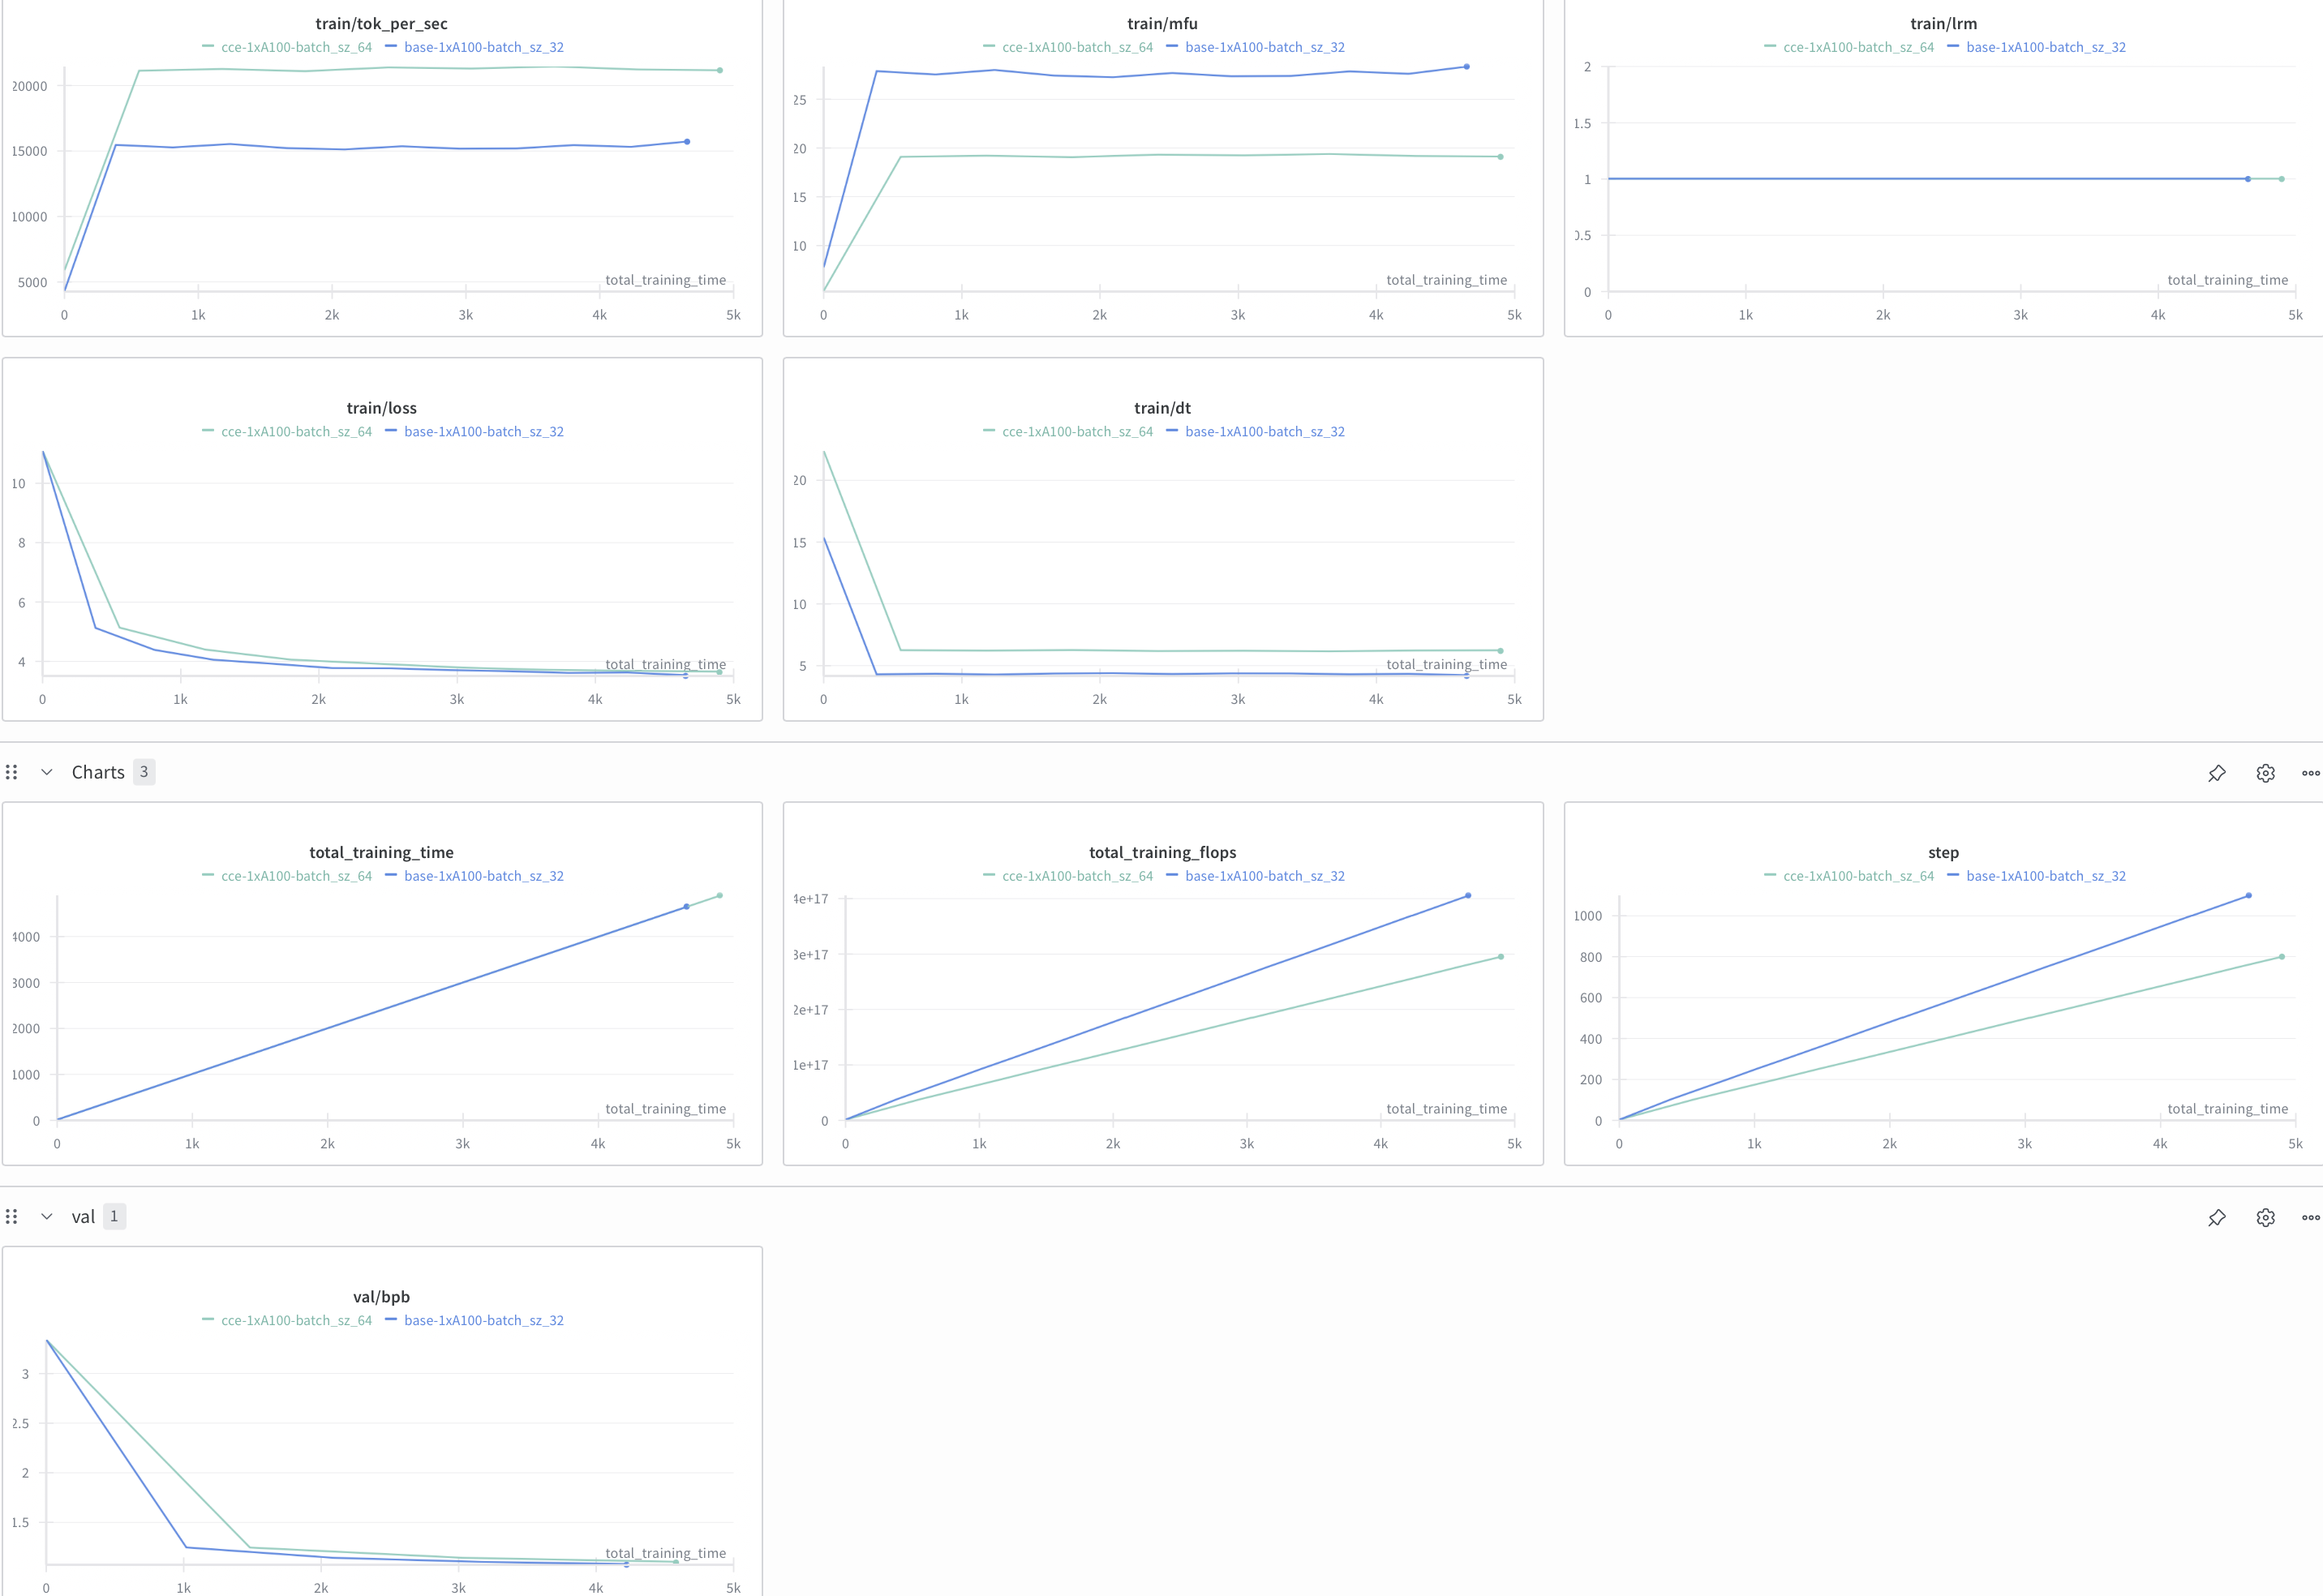
Verdict: for my 1B setup and current hyperparameters, chunked/fused cross-entropy hasn’t been worth it. The memory savings don’t compensate for the step-time hit and the convergence risk, so I’m not introducing it into this training run.
8-bit AdamW
I alluded to this in Part 1. I messed up the first experiment, so I re-ran it properly. Here are the results:
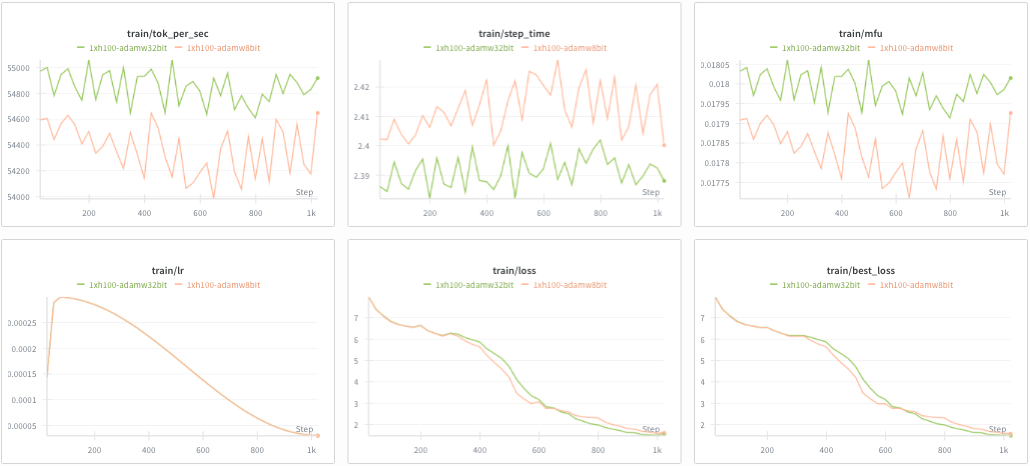
It seems to converge similarly, which is great given it saves a decent chunk of memory. The MFU drop is on the order of 0.1% and so, is negligible. Memory usage goes down because the optimizer states are stored in 8-bit instead of 32-bit. MFU drops by ~0.1% due to the extra de/quantization work each step.
Verdict: If I need more memory for other parts in the step, I could introduce AdamW8bit. Even though it works empirically, I want to use the FP32 version as it is not lossy and has a slightly higher MFU.
FP8 Math
H100 (Hopper) supports FP8 (E4M3 & E5M2) natively. I’ll keep master weights in FP32, but use FP8 for some linear layers to try to squeeze out more throughput. The de/quantization overhead will eat into the gains, but Hopper’s FP8 Tensor Cores should still help if we’re compute-bound.
For now, let's only touch the linear layers from our model.
Nvidia's Transformer Engine
First things first, I love the intuitiveness of TE API to do FP8 linear ops. However, in my setup TE gives me similar step time but higher reserved memory:
Step #2 | Input Size: [4, 2048] | Time: 0.151s | Reserved Memory: 37.98 GB | Loss: 10.239
Step #3 | Input Size: [4, 2048] | Time: 0.141s | Reserved Memory: 42.28 GB | Loss: 9.975
Step #4 | Input Size: [4, 2048] | Time: 0.141s | Reserved Memory: 42.28 GB | Loss: 10.071
This is the recipe I used:
fp8_recipe = DelayedScaling(
    margin=1,
    interval=1,
    fp8_format=Format.HYBRID,
    amax_history_len=16,
)
I played around with the recipe hyperparams, but the performance profile barely moved. For this workload -> not useful.
TorchAO
TorchAO is interesting, the first time I tried it I must have made a mistake in it's implementation, it gave me significantly worse numbers. So, I dove deeper into the docs and found an excellent function for fp8 which I previously overlooked. I like that it works with autocast and compile... makes life easy.
All I had to do was add this after initializing the model:
ao_config = Float8LinearConfig.from_recipe_name("tensorwise")
convert_to_float8_training(model.layers, config=ao_config)
On [64, 2048] token inputs, with the tensorwise recipe, step time reduced by 10% while memory dropped by 20%!!! rowwise recipe might be more numerically stable, on my perf bench it was 2% slower than baseline but with the 20% drop.
Let's train it for 1k steps and see their performance:
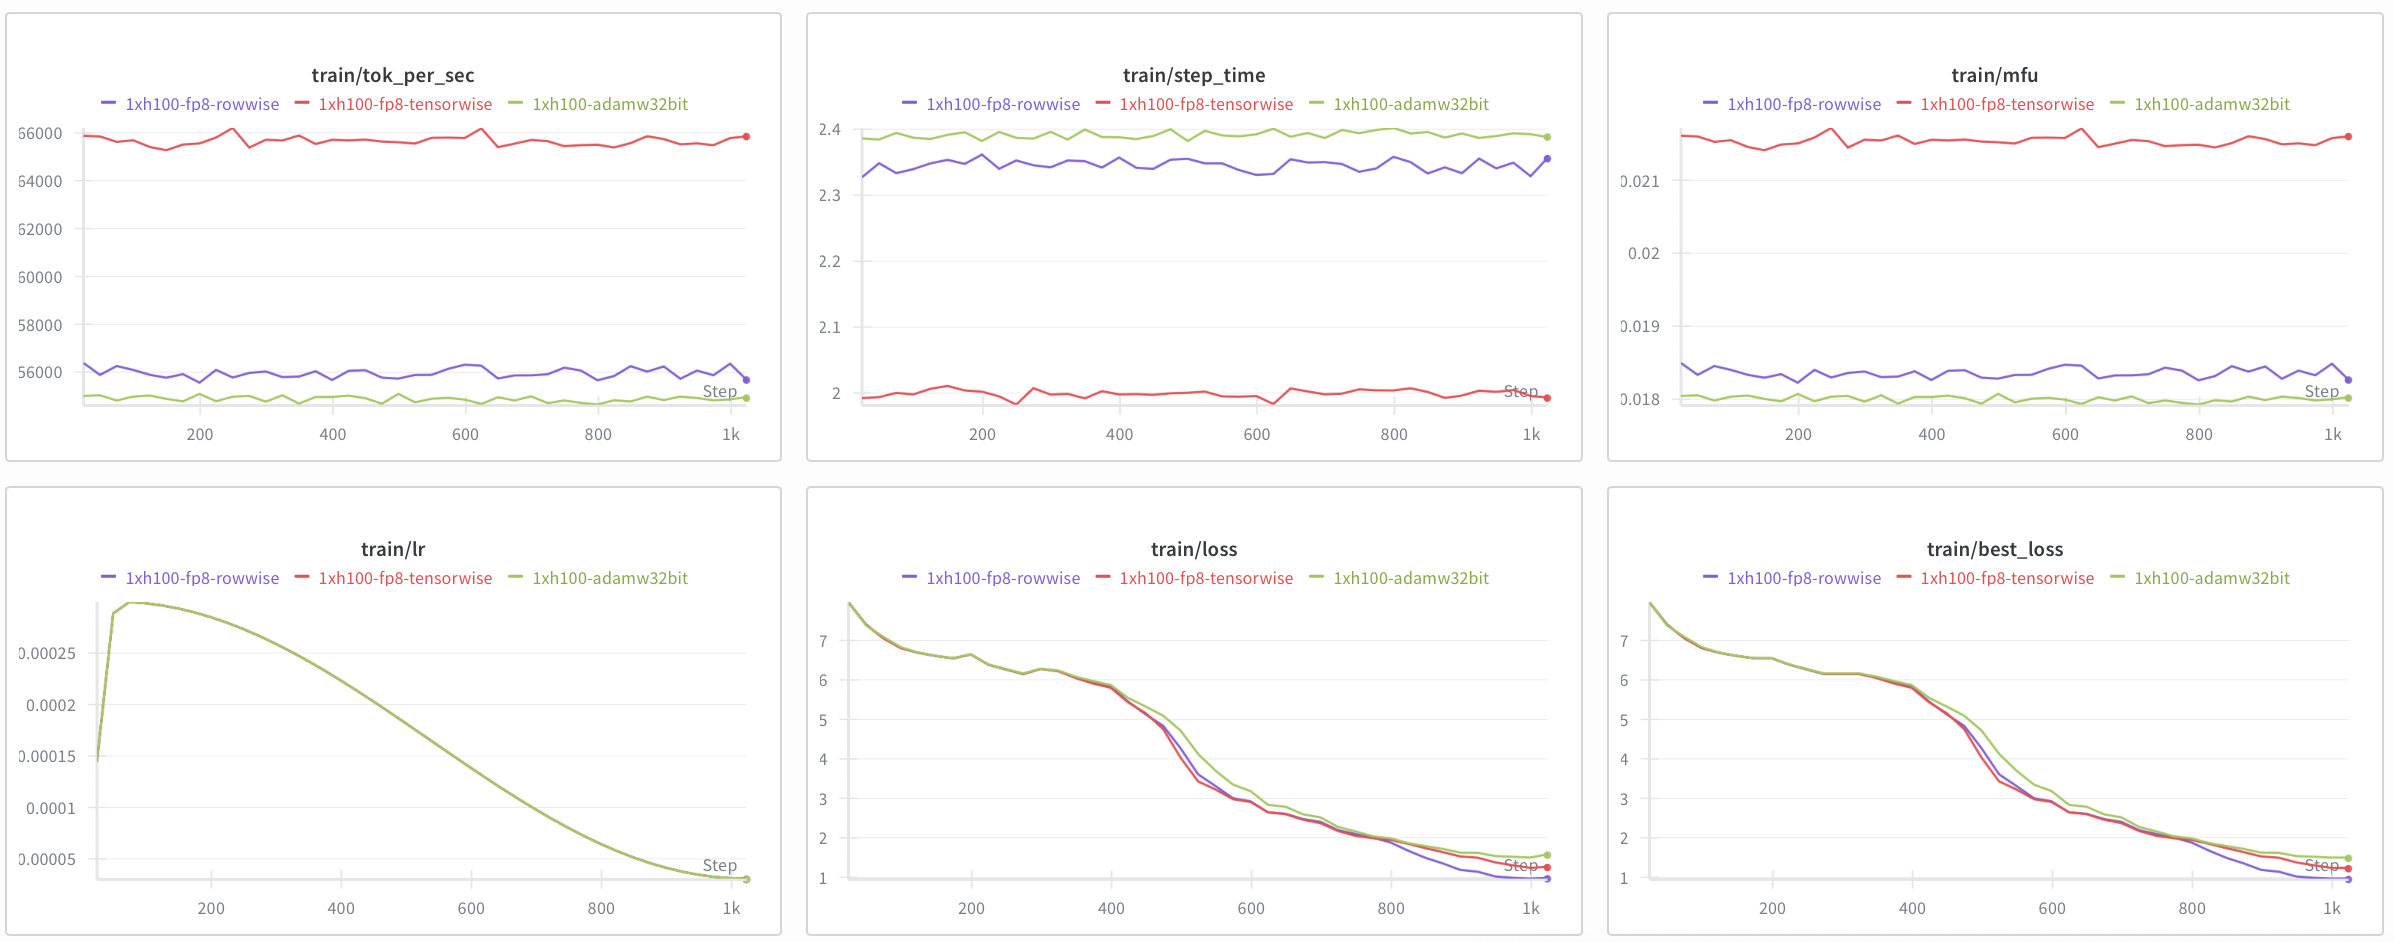
The convergence for rowwise might be better but tensorwise works as well while being faster.
FP8 Flash Attention
fp8 backward pass does not exist (only bf16/fp16 allowed), so I end up using SDPA. FWIW, I think FA3 was useful a few months back, PyTorch team likely improved torch.compile for Hopper. I could use Transformer Engine's FP8 attention but it likely introduces a graph break and might not give a lift worth the effort.
Custom Kernels?
I am out of ideas for torch-based 1xH100 optimizations. Let's see if our traces give us any clues on low-hanging fruit.
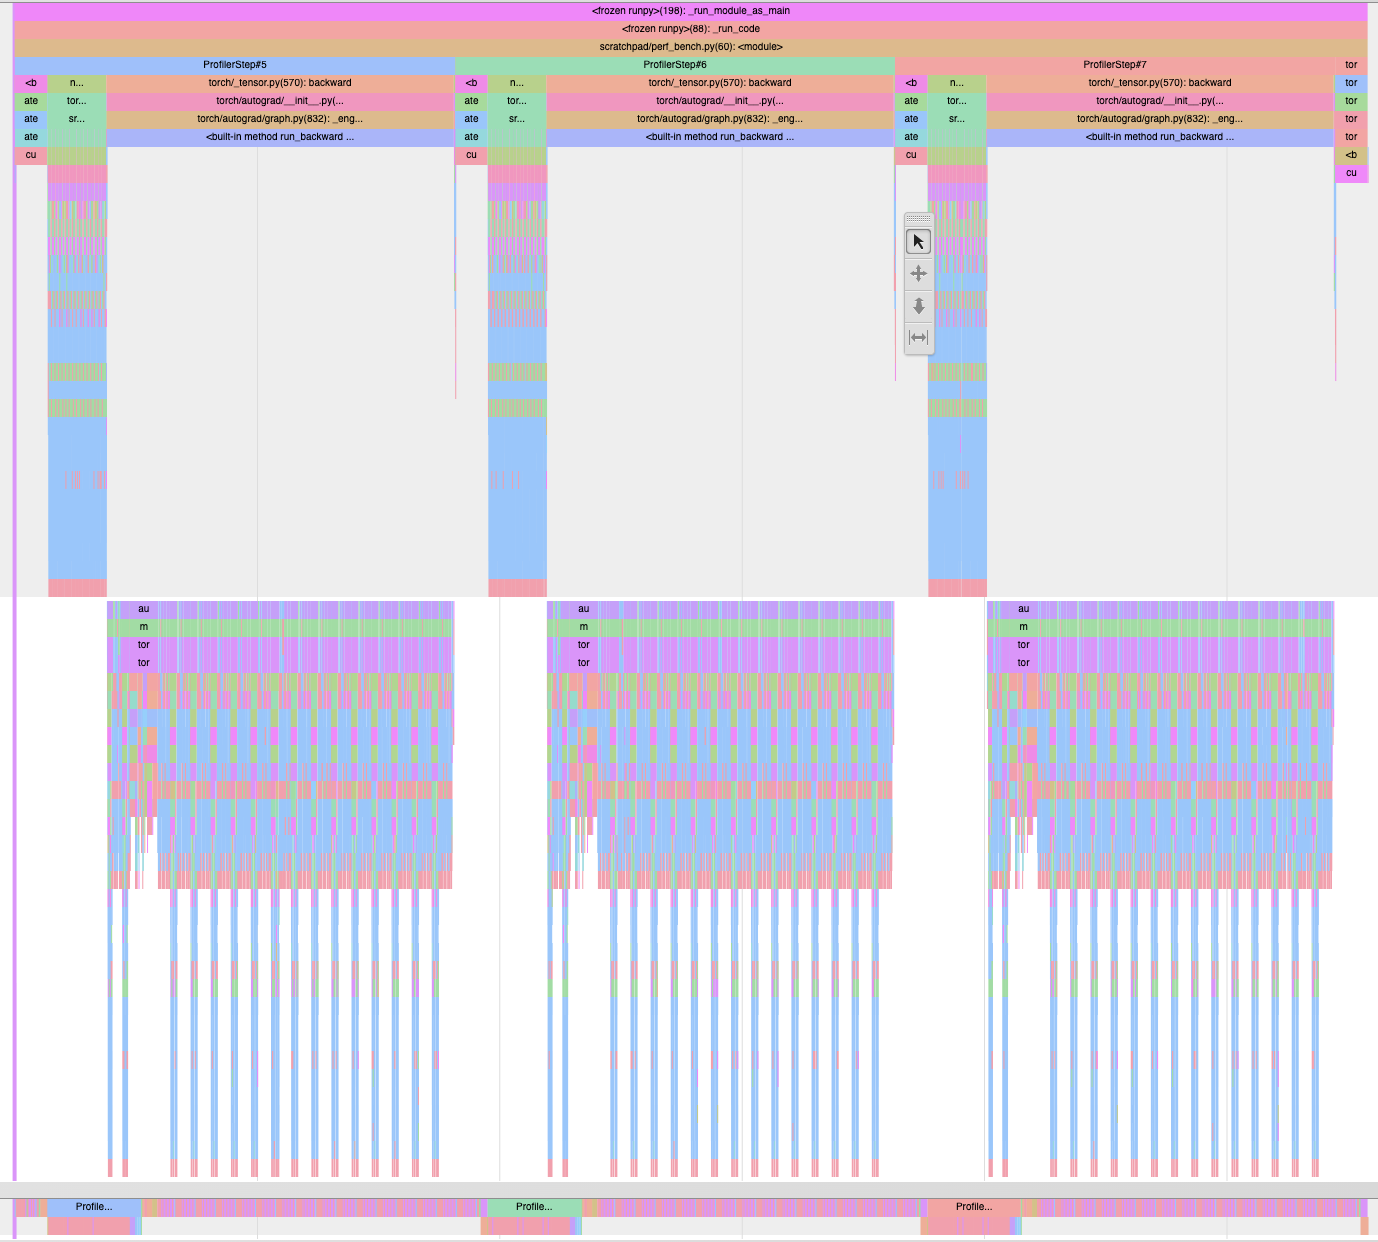
This is the PyTorch profiler trace without torch.compile. Before producing this trace the profiler skips the first two train steps (to avoid capturing torch.compile overhead), warms up on the next three steps and finally, captures only the subsequent three steps.
This is the trace with torch.compile.
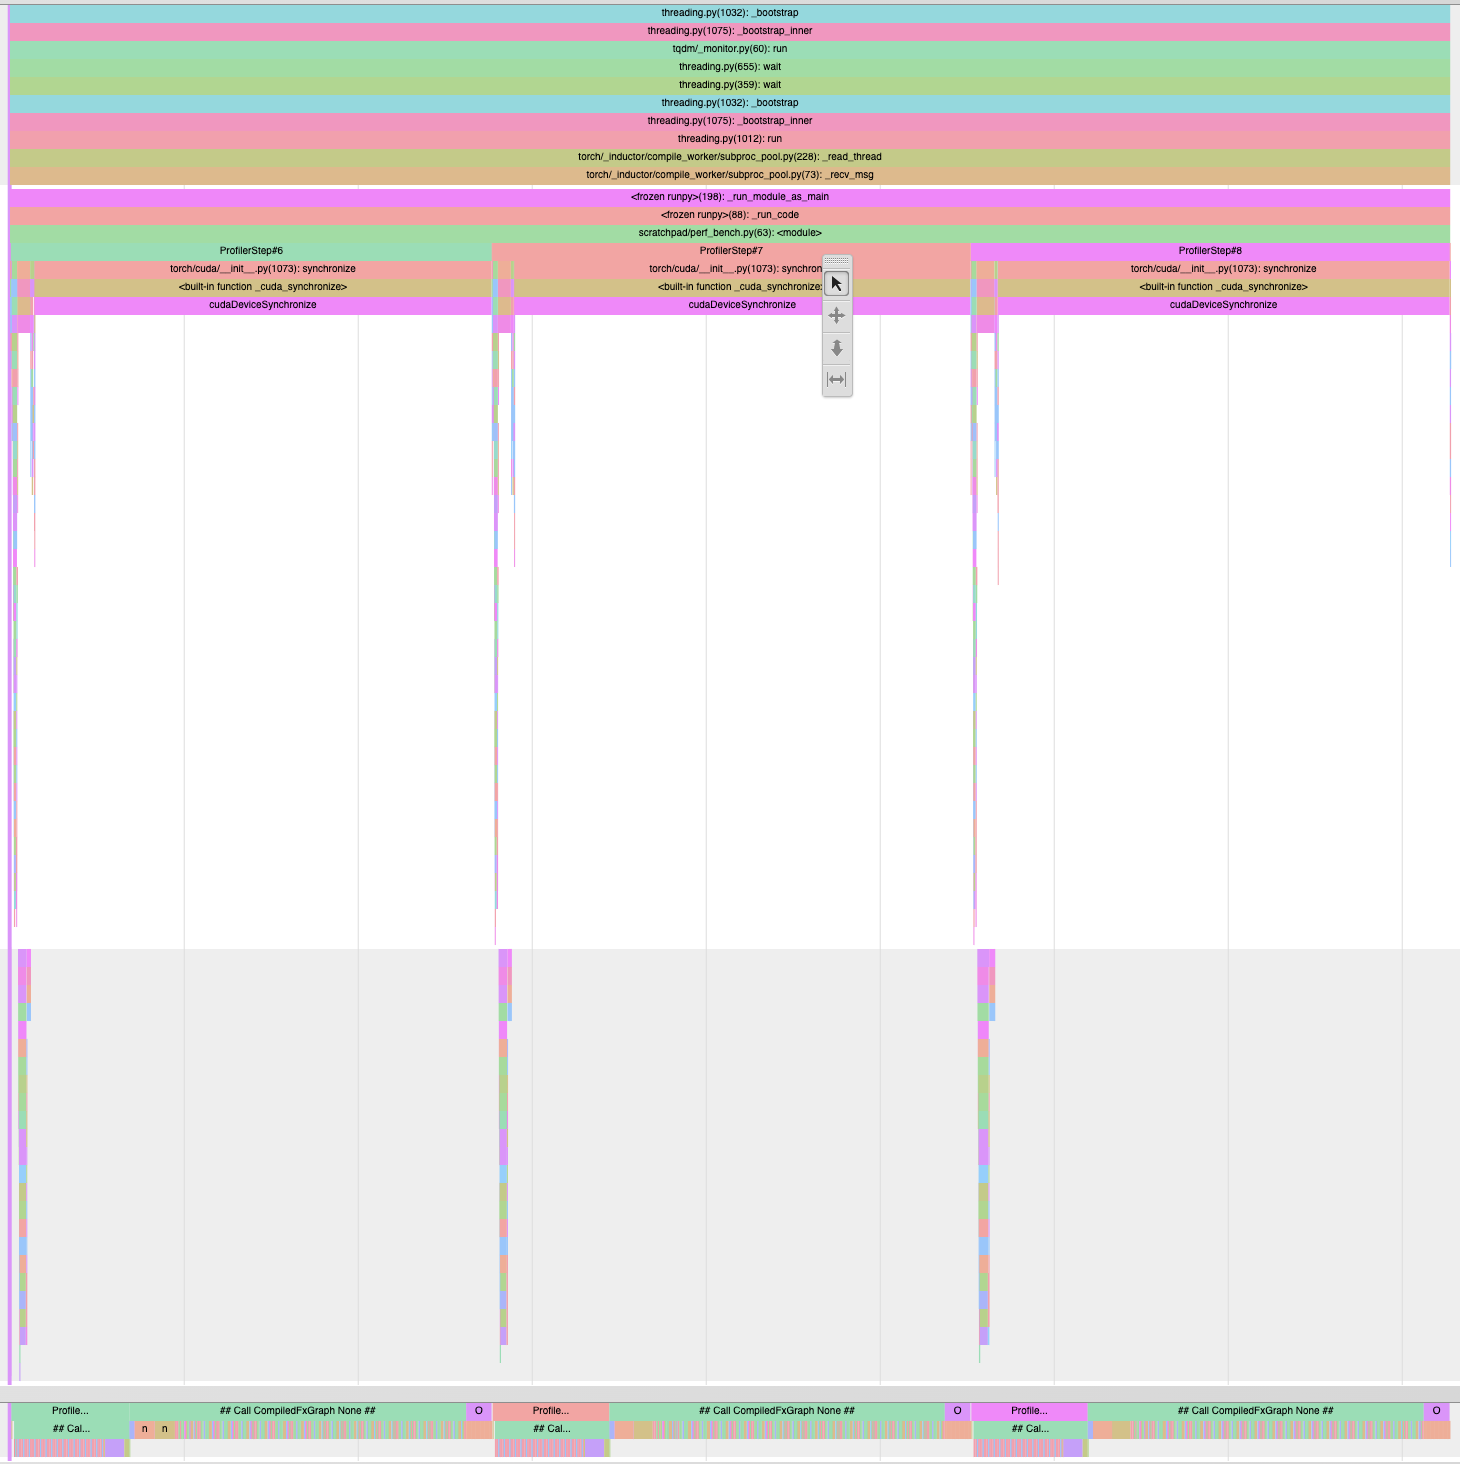
You can see a clear difference in how much python/cpu overhead each have. If you squint, you will also see the cuda_graph being run by python in the second graph. While the following profiles are from two different phases of the training step, they pinpoint kernel launch overhead.
Without torch.compile:

With torch.compile:

While I am no Scott Gray (maybe one day), I can write decent custom kernels with Triton (it is actually easy to pick up). Looking at this compile trace, I don't think I can produce any meaningful MFU boosts on top of torch.compile's progress.
Actually, I will not give up so early, let's check nsys (Nvidia's profiler) to see these in more detail. I will let you read the goat's - Piotr Bialecki's - memorandum to learn more about Nsight Systems.
Quick setup:
1. Install Nsight Systems for your target distribution from the web
2. Transfer to your cloud instance
3. sudo dpkg -i nsight.deb
4. Setup nvtx.push_range in your PyTorch code based on what you want to profile.
5. Then, use the command I provide below.
Note: AI is not great at nsys for some reason. I had to debug my way to a good nsys profile on my cloud instance/setup, ChadGPT and Claude both asked me to stick to PyTorch profiling. I had to dig through old nvidia blogs, forums and new docs to piece concepts together (not as bad as i make it sound tbh). I used this to run the profiling on my bench:
/opt/nvidia/nsight-systems-cli/2025.5.1/bin/nsys profile \
    -o profile \
    -e NSYS_NVTX_PROFILER_REGISTER_ONLY=0 \
    --capture-range=nvtx \
    --capture-range-end=stop \
    --nvtx-capture=CAPTURE_REGION \
    --trace=cuda,nvtx,osrt,cudnn,cublas \
    --force-overwrite=true \
    python -m scratchpad.perf_bench
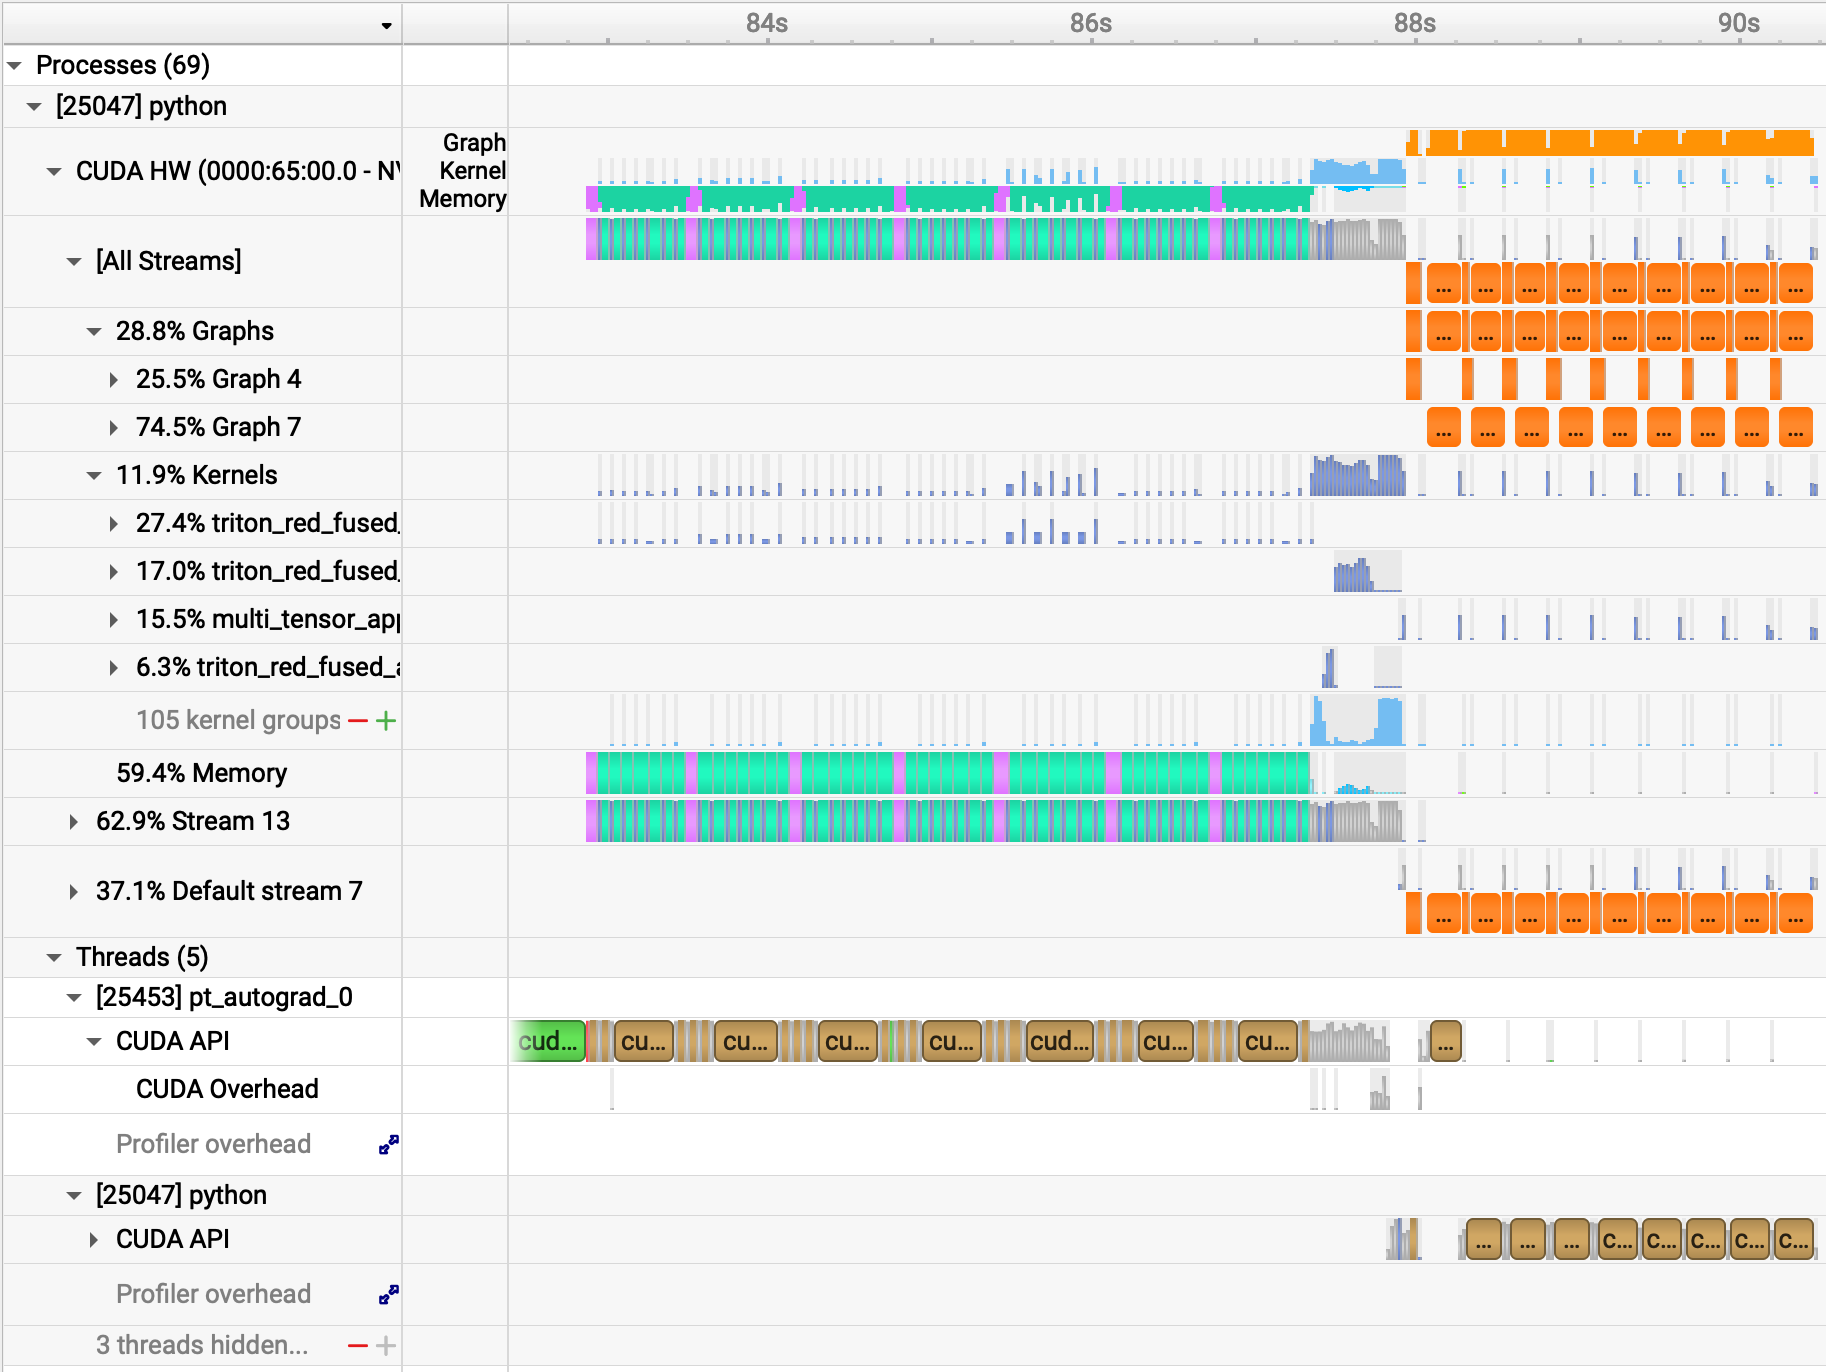
Let me do quick observations from this zoomed out look:
- The brown boxes are cudaSynchronize()'s and there are a bunch of them.
- My profile view starts from 82s because
torch.compileends at approx 82s and it looks like empty space before that, interesting stuff starts from 82s onwards. - The turqouise bars are Memcpy Host (CPU) to Device (GPU) and purple is Device to Host. I am not sure but I think in the first 80s,
torch.compileran on a model with different fake inputs, and model compiled. 80s onwards is model running step #0, step #1 from 88s, step #2 from ~88.3s, etc. - We can see that -> 28% of the time are graph runs (good), 11.9% are individual kernels (not great) and 59% goes to memory (BAD).
If you believed what I wrote in #4, well, you got got. Those percentages are over the entire run (model load + compilation + warmup + training), so they’re useless for understanding steady-state training. We only care about the per-step view after warmup. Here is what 2 warmed-up steps look like:
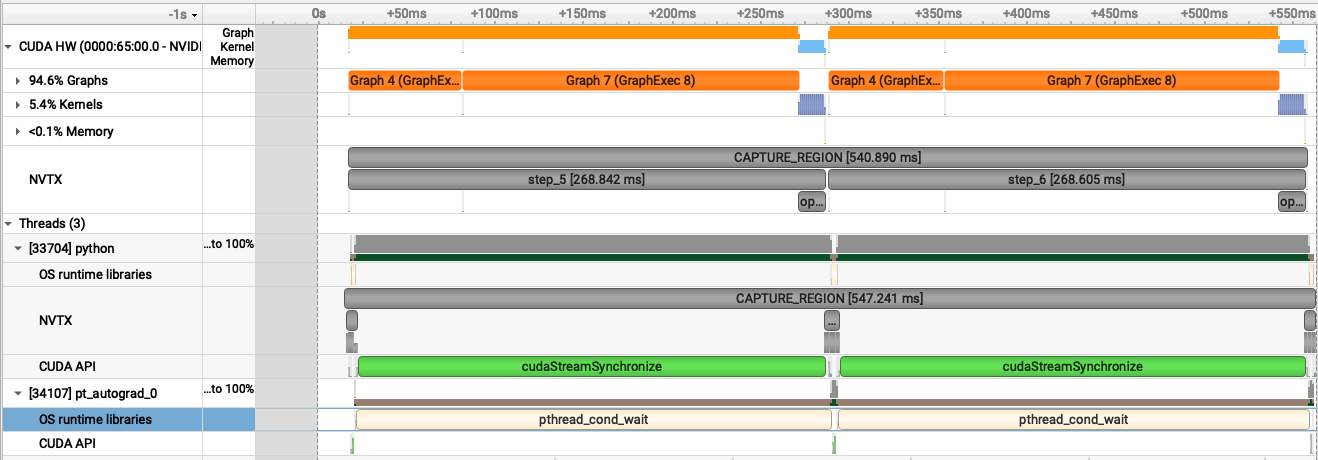
Observations:
- 95% Graph use!!! <0.1% Memory access times is a great indicator we are on a good track. 5.4% kernel time come from the optimizer which can't be optimized further.
That's it, lads and lasses, there is not much else we can do, I think we are compute bound (another sign is nvidia-smi dmon shows >=99% sm utilization). To be fair, compute bound doesn't mean you give up, it's a sign to get under the sheets with your algorithm and find ones that work better with your hardware (like Tri Dao did with Flash Attn 3). I am a bit disappointed I couldn't work my kernel magic but that will come when we get to the BLASphemous work - kernels that plain torch.compile cannot handle - in the future. I'll also be using Nsight Compute (not only Systems) software over the next few blogs.
I also added profiling code to my pretraining file (instead of bench like above), this is the result I get:
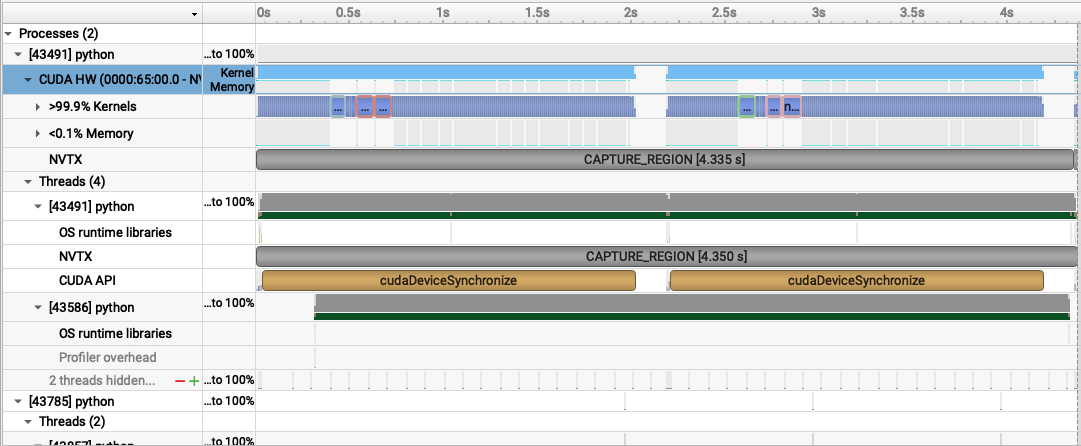
Note: I added --cuda-graph-trace node to my profile which introduces overhead but gives visibility into what kernels runs within the cuda graph as well.
I also profiled a distributed run with 4 gpus.
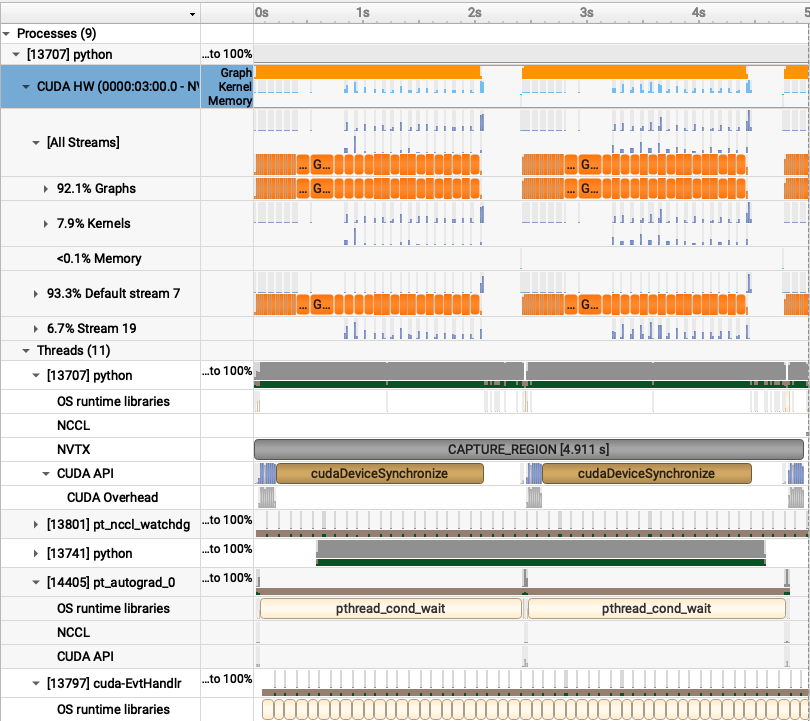
Notice, how there are many graphs instead of only two as in our non-distributed setting. Initially, I thought it could be an artifact from introducing DDP but on a closer look, the forward pass has graph breaks too??
Dataloader
I did not originally have this section but looking at the full view of my profiles, I noticed a big gap between the end of step 1's optimizer step and step 2's forward... which means I totally forgot to optimize the dataloader.
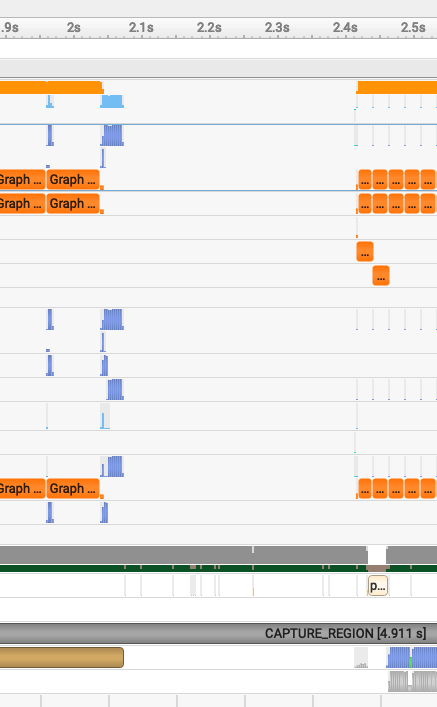
This one is simple, these GPU nodes have a lot of CPUs, I put them to work, set num_workers on my DataLoader to 8 and prefetch_factor to 4 and we are back in business, 50% reduction in total time to load 50 batches of [64, 2048]. This should help just a lil on boosting MFU.
My dataloader is not the best right now, I need to give more thought to what happens at checkpoint resumption for deterministic training. This is a later problem.
Overlapped DDP communication
I kept this as a separate section to emphasize that overlapping has already been taken care of by Torch DDP. The gradient bucket sizes were small enough and you can see in the image above all the blue boxes above each layer's backward pass's orange graph boxes... those are gradients being communicated in parallel to the next layer's backward pass. This is the standard DDP bucketed-allreduce pattern, it overlaps gradient comms for earlier layers with backward compute on later layers. Really beautiful work by torch team to give this out for free.
Compressed gradients in All Reduce
So torch.distributed has a hook to compress gradients to fp16 before an AllReduce. This cuts communication overhead by half! Gradients tolerate fp16 quantization reasonably well in practice (with scaling), so compressing them to fp16 before all-reduce is a common trick to halve communication volume.
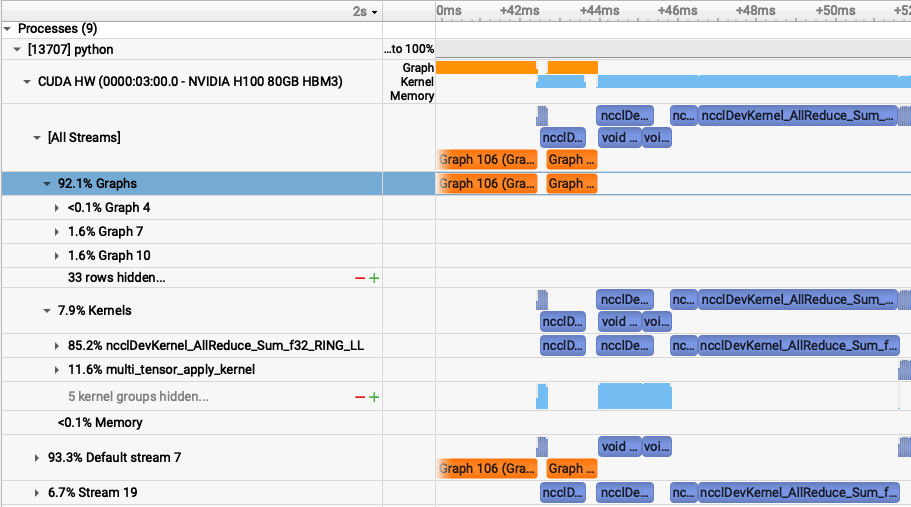
All other "overhead" goes away due to overlapping. Compressing gradient will likely save us 5ms out of 10ms that we see here? I don't think this is worth saving for now. Now, let's get to some more interesting experiments.
Training convergence
Faster training runs could be a result of not only higher training throughput but also faster convergence. I was tempted to use Muon in our last run but a good, simple baseline was the priority. In this blog, I want to reason through different hyperparams and try out Muon (especially now that it is a part of Torch). I only have a limited compute budget, so I refer to other works to shortcut some of this.
Learning rate
What Karpathy did in Nanochat was very interesting: assigning different learning rates for embedding & LM head (to be used with AdamW), separate from the learning rate for Muon.
We already have a baseline with 3e-4 (a.k.a Karpathy Constant). A very interesting trick in the industry is figuring out hyperparams on smaller models and scaling up/down based on attributes like sqrt(batch size ratio), depth ratio, etc.
For example, look at Llama 3's hyperparam breakdown from their paper.
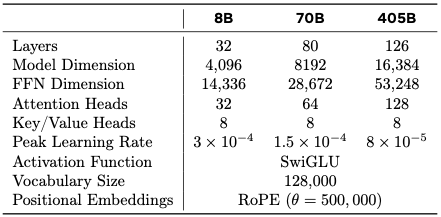
This is totally a self-made explanation and the paper does not mention this... but notice how as the model gets bigger, learning rate is scaled by 4096 / model_dim.
For model_dim=4096 : lr is 3e-4
For model_dim=8192 : lr is 3e-4 / 2 = 1.5e-4
For model_dim=16384: lr is 3e-4 / 4 ≈ 8e-5.
Rough empirical heuristics from my chat with Claude: lr grows with batch size and often shrinks with depth. The Llama 3 table looks consistent with an lr ∝ 4096 / model_dim pattern, but that’s my interpretation, not a stated rule.
Running hyperparam search on large models is very expensive, so we run it on smaller ones and calculate hyperparams for the larger ones based on heuristics.
To make it even cheaper, my idea is to use an 8xA100 instead. I will be running grid search across 8xA100's with one experiment running on each A100. I will be using a [32, 2048] batch size and 8 hidden layers as opposed to [64, 2048] and 16 hidden layers on the H100.
WE HIT A SNAG
Do you notice the problem here?
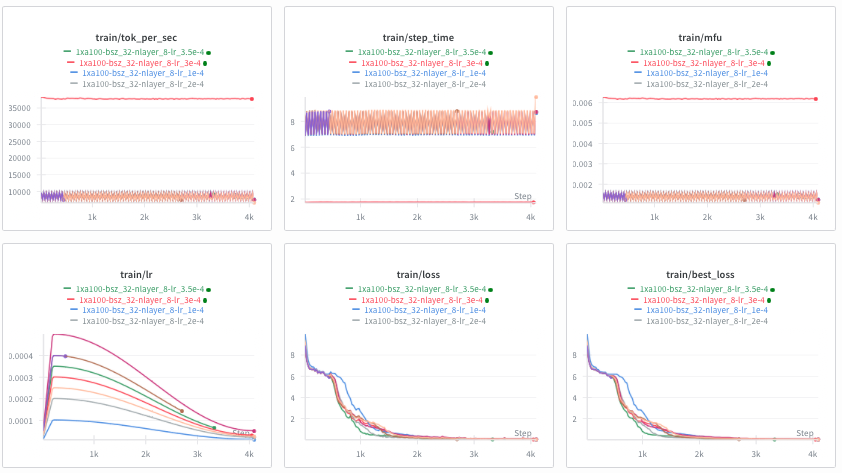
The train/loss is way too low in the 1e-2 range. I don't really know how to debug this which is the next issue... I don't really have a validation metric.
At first my thought was is my model training on the same batches, confirmed it not to be the case.
After talking with Claude and reasoning through this a bit more, I am going to introduce a few more metrics to be logged:
- val/loss: load one set of data, run with torch.no_grad() the forward pass on it and get the loss.
- norm_per_param: Separate curves for embedding, lm_head, first and last decoder layer.
- grad_norm_per_param: Gradient of lm_head, embedding and a few layers before clipping.
- 50 tokens generated after the sentence "The meaning of life is "
I am hoping to catch weird patterns and reasoning through potential causes. I am very glad I have Claude beside me to cover my knowledge gap, 10 years back this would take a team of researchers scratching their heads for a while and reading through many papers. Simply having someone spitball investigation ideas is a massive boost, the onus of implementation and reasoning through it is still on me (and I enjoy that).
This is what I see:
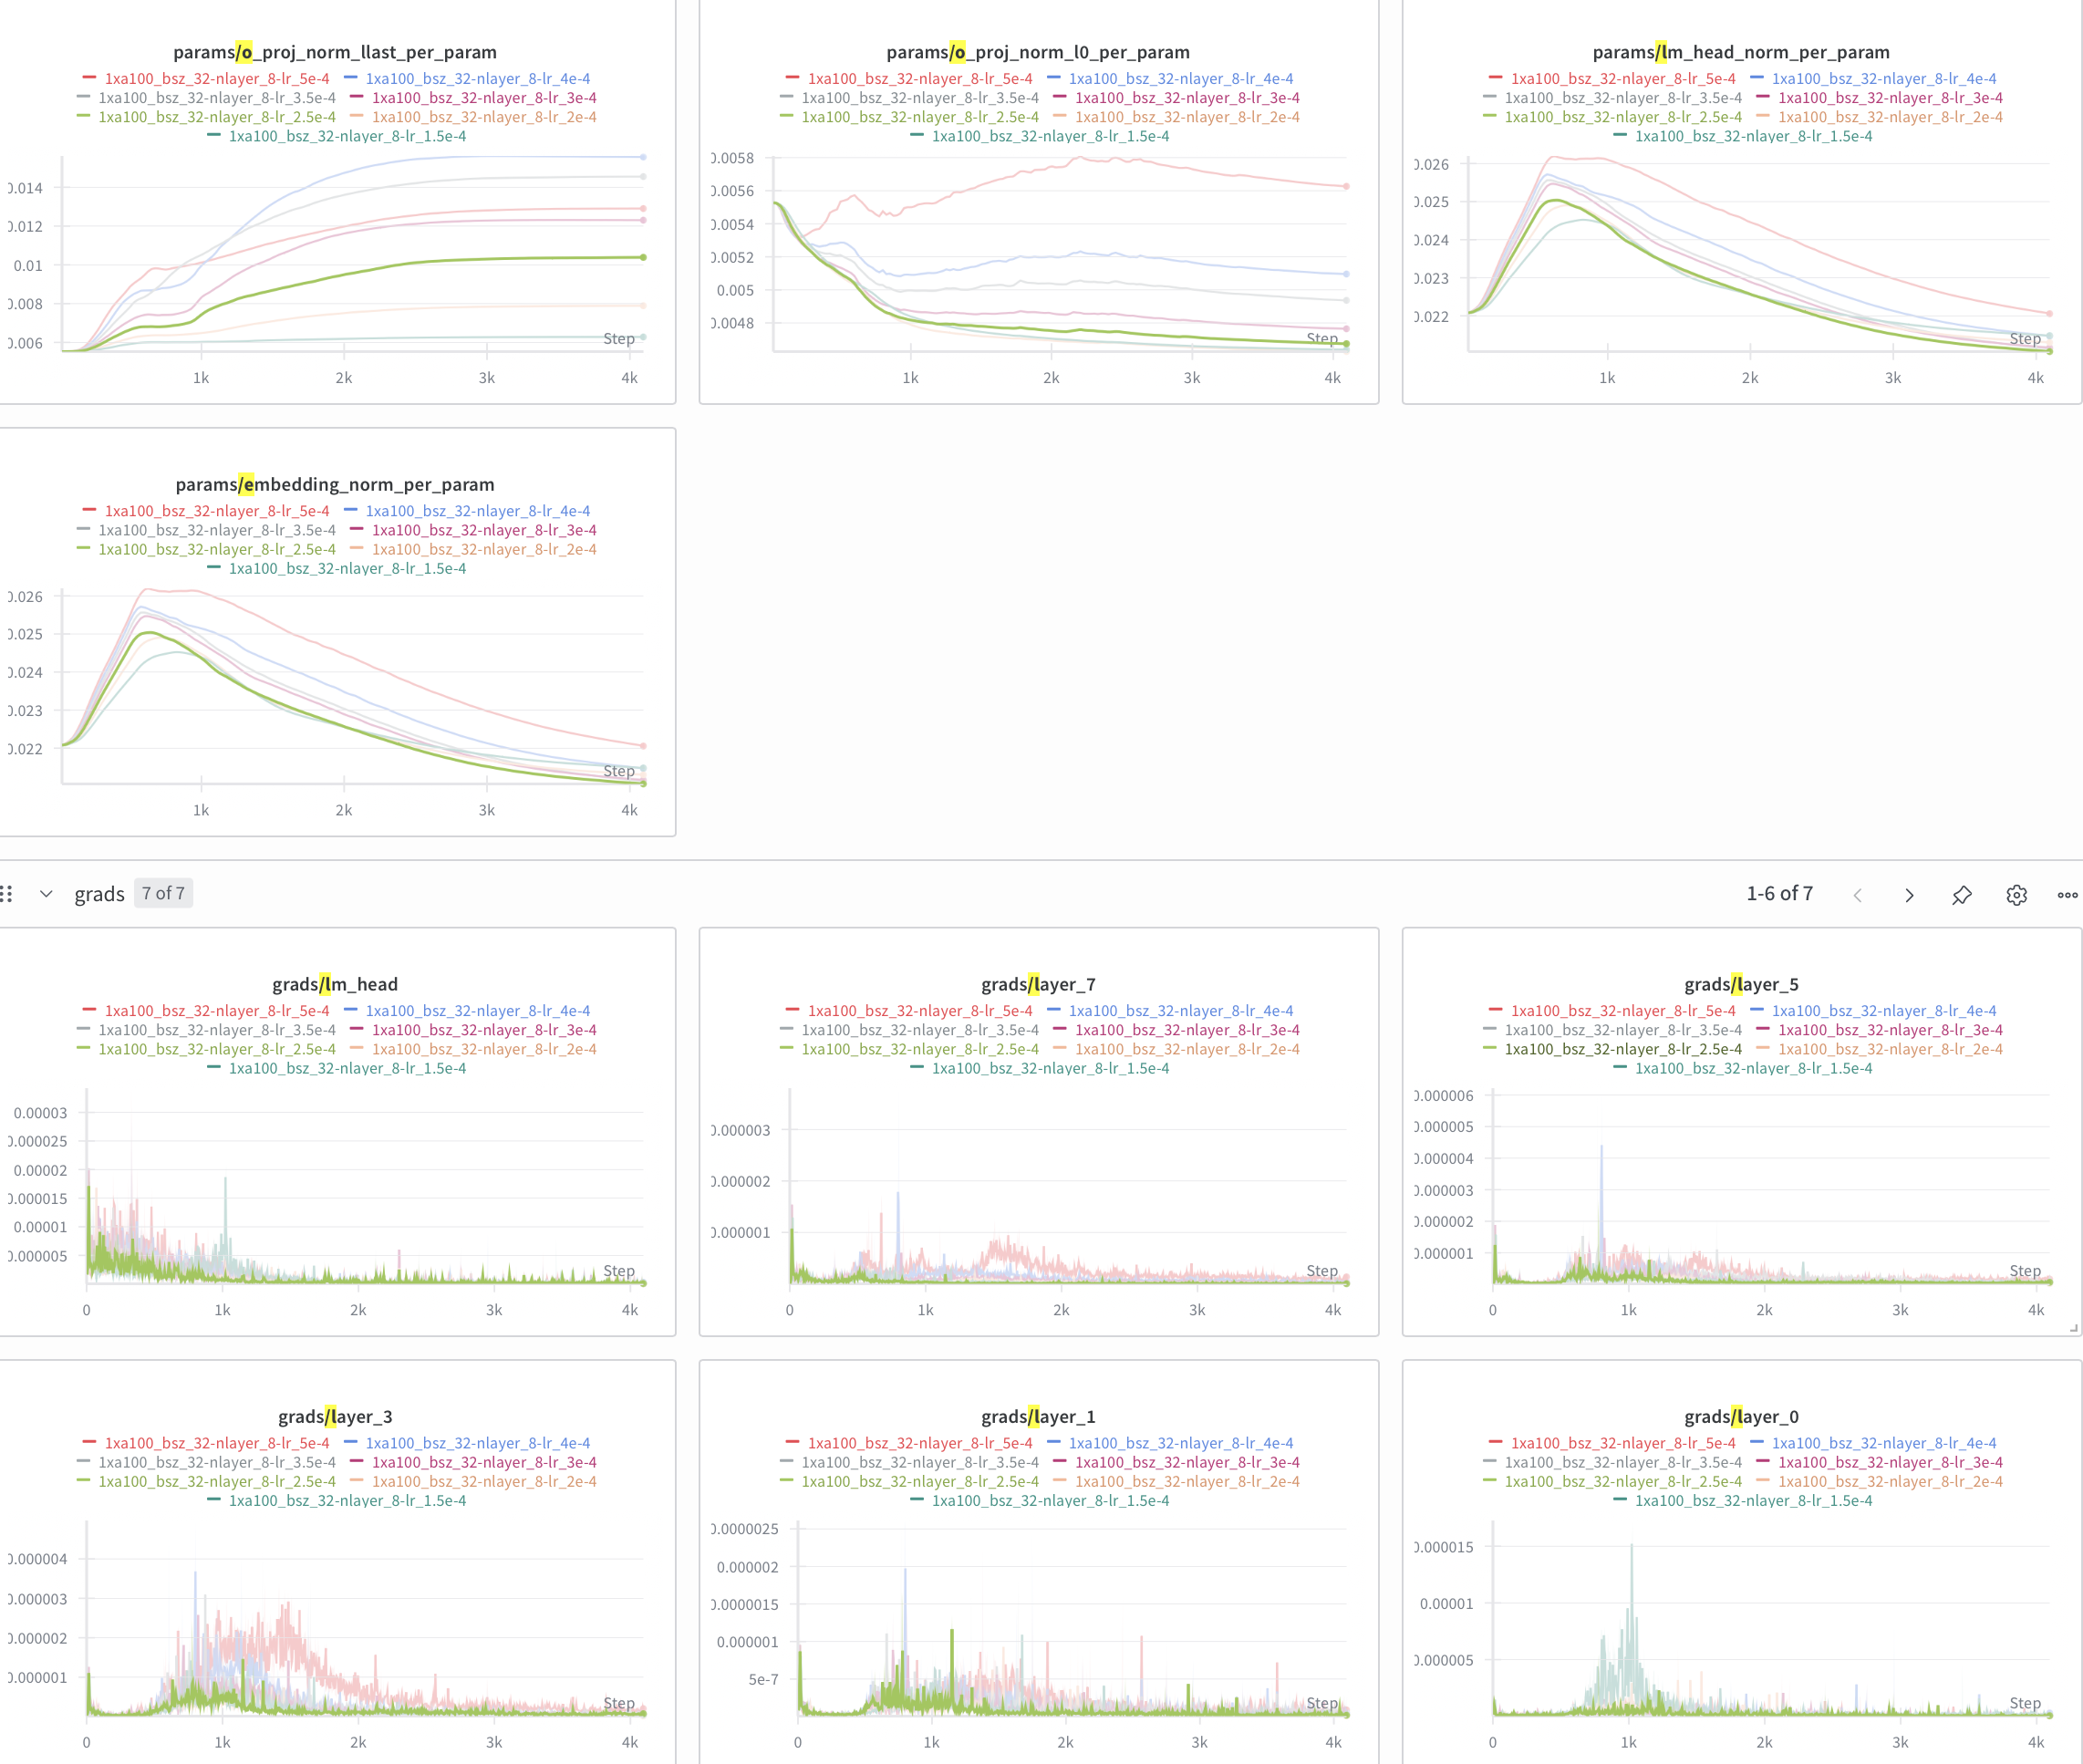
In all the params/ graphs, something happens to each graph around step #500. Why?? I still couldn't triangulate where the error could be coming from. So, I logged a few more items:
- top1_acc: accuracy of the highest logit result
- raw_ce_fp32: Cross Entropy loss on a small subset of data (to avoid memory explosion) done with FP32 weights and inputs
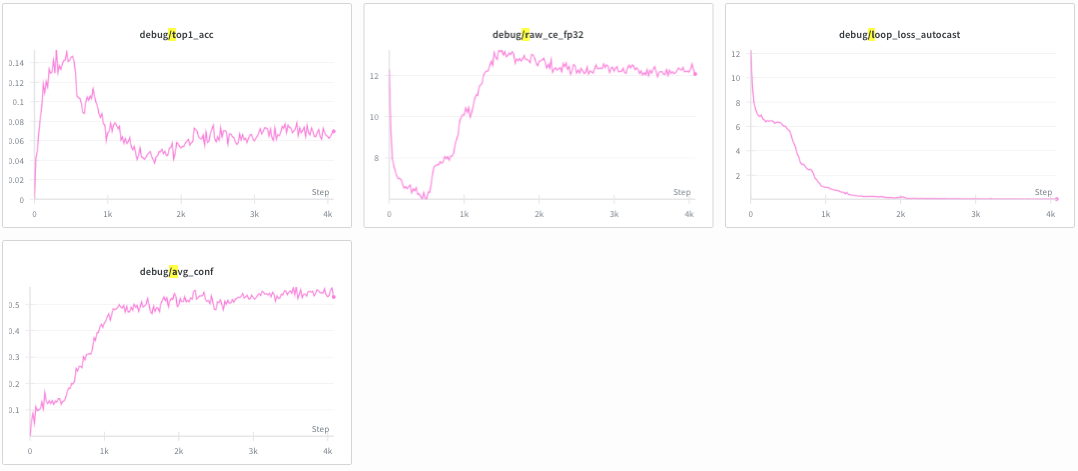
Now, the problem is visible. Notice how at step #500, fp32 cross entropy loss explodes while loss plummets. The model is funked up. There is a bug in my code in model.py:
if targets is not None:
    loss = torch.nn.functional.cross_entropy(
        logits.reshape(-1, logits.shape[-1]),
        targets.reshape(-1)
    )
    return loss
else:
    return logits
The bug: I was computing CE inside autocast, using bf16 logits. The bf16 CE quietly diverged while the “true” FP32 CE exploded around step 500. That made train loss look too good to be true.
The fix: I need to take cross_entropy out of autocast and perform loss calculations in my train loop instead. This will cost me a ton of memory but should meaningfully improve my model. This bug in my larger run was silent, but in smaller models, such small bugs tend to explode and become salient. I tried FP16 + GradScaler but that did not help either.
At this point I know I fudged up, a lot of the optimizations I made have to be reworked. On my 1xA100, doing CE outside of the loop is causing OOMs on OOMs, so, instead of training on [1, 2048], I trained on [32, 128] batches (smaller ctx length but good batch size for stability) to see if raw fp32 loss keeps going down. These were the results:
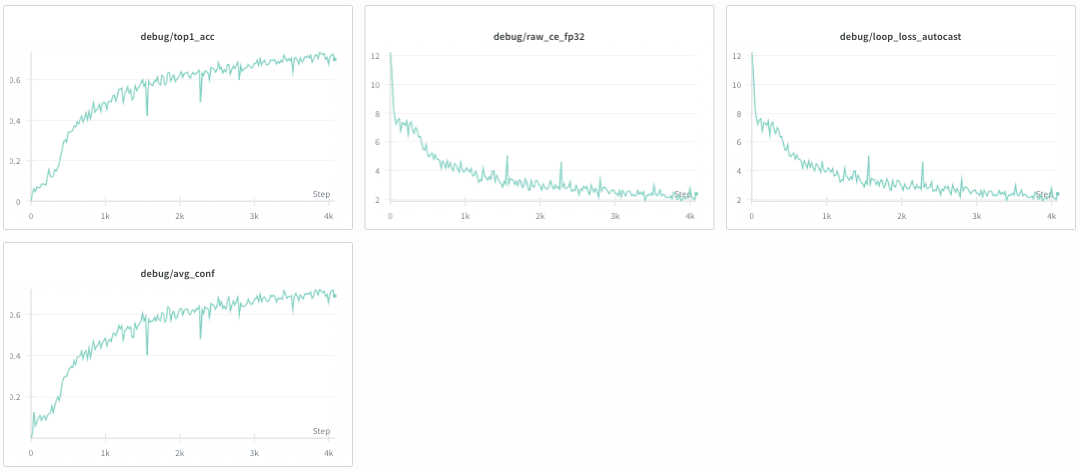
Now, loss is going down, accuracy goes up... consistently.
Conclusion
I know this is an abrupt ending. I had way more planned for this article but the CE bug messed with my plans. I even considered not posting this but the ultimate point of this series is to take you through my journey of getting to SOTA along with the ups and downs. LR tuning will continue next blog.
In this blog, my meaningful improvements were adding fp8 linears, making my dataloader faster via multi-processing, and fixing a gnarly bug which would have messed up all my future training runs.
See you in the next one!
Omkaar Kamath